
JACKSONVILLE, Fla. — You can become a part of the First Alert Neighborhood Weather Network. Scan below &/or click * here *:
After a very warm first couple of weeks of Feb., the pollen season has quite literally exploded across Jacksonville/NE Florida & SE Georgia. At Action News Jax in partnership with the Jacksonville Sinus & Nasal Institute, we are very fortunate to be able to provide real time allergen readings including all tree pollen, dust, grass, mold & smoke particulate to name just a few.
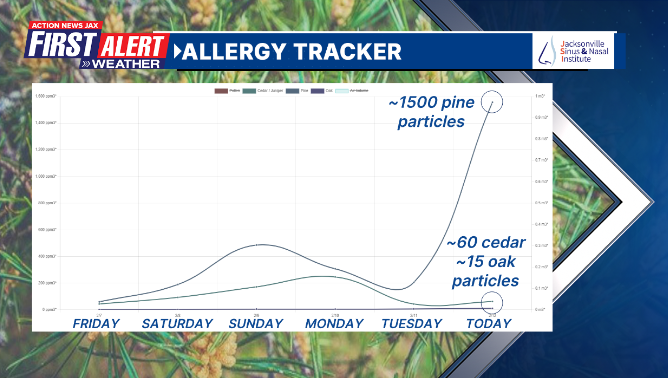
Right now it’s cedar & especially pine pollen that is most problematic. The allergy tracker below shows the quick rise from Fri., Feb. 7th to Wed., Feb. 12th when the pine pollen quite literally blew up. Breezy, warm & dry days are the worst days for pollen while damp/wet & cool days are generally better (brief relief as the rain acts as natural “cleanser” of the atmosphere. Traces of oak pollen are already showing up & will increase further in the coming weeks likely peaking by late Feb. into early & mid March (weather dependent).
The so-called misery index - or as I prefer to call it ‘sneeze-dex’... has had numbers greater than 75 which correlates to ‘severe’ symptoms for those with allergies.

The images below show the pine pollen “picture” - or slide - from the week of Feb. 3rd vs. Wed., Feb. 12th in the late afternoon. The squares in the first image point out each grain of pollen. The second image was overtaken by miniature marshmallow-like objects which is the very dominant pine pollen.


Here is how the unique “Pollen Sense” instrumentation works:
Automatic Particle Sampling by Pollen Sense -
Averages are calculated every hour. In addition to hourly averages, daily, weekly and monthly values are available.
Samples are gathered automatically and microscopic images (and the resulting data) can be viewed anywhere there’s an internet connection.
People who don’t have expertise in air-quality science or aerobiology are able to examine and understand the data.
Experts train models that are running algorithms based on artificial intelligence. The A.I. is consistent across the network and works around the clock.
An automated sensor network scales readily. Multiple sensors provide redundancy or higher granularity to the data and ongoing costs are reduced.
#firstalertwx The one & only - in Jacksonville/NE Fl./SE Ga. - "Pollen Tracker". Thanks to Jacksonville Sinus & Nasal Institute, the pollen sensor is on the top of the studios of @ActionNewsJax measuring any & all pollen, mold, dust & overall air quality in *real time* @WOKVNews pic.twitter.com/x0fu7xggHu
— Mike Buresh (@MikeFirstAlert) February 11, 2025
So our - Jax/NE Fl./SE Ga. - winter has been one of extremes no doubt - from a near “average” Dec. which started very cold through the first 10 days - to a bitterly cold January followed by an unseasonably mild to warm first two weeks of February. I mentioned in a blog entry in mid January that a La Nina (cooling of the Pacific equatorial ocean temps.) winter - such we are enduring right now - is often characterized by large temp. swings that can range from very mild to very cold. This rollercoaster temp. pattern will likely persist into at least March.
An interesting map below shows the winter season severity index *so far* (through Feb. 11th) from the Midwest Regional Climate Center (MRCC). No surprise Jacksonville has a blue dot - ‘severe’. ‘Extreme’ winters so far for Pensacola & Charleston & a ‘record’ winter for Mobile (largely due to record snow & cold in January). Many northern cities are ‘mild’. We’ll see where we end up as we transition to spring but northern latitudes are going to play ‘catch up’ over the next few weeks. Mother Nature has a remarkable ability to balance things out.


A review of the methodology:
Defining the AWSSI Season:
The AWSSI is not limited to meteorological winter (December ‐ February) but is intended to capture winter weather from its earliest occurrence to its last.
The winter season begins with the first occurrence of any one of the following:
- First measurable snowfall greater than or equal to 0.1 inch.
- Maximum temperature less than or equal to 32°F.
- Winter season begins on December 1 if conditions above have not been observed.
The winter season ends with the last occurrence of any one of the following:
- Last measurable snowfall greater than or equal to 0.1 inch.
- Last day with 1 inch of snow on the ground.
- Last day with max temperature less than or equal to 32°F.
- Winter season ends February 28/29 if the above conditions have occurred.
How the AWSSI Accumulates
Daily scores are calculated based on scores assigned to temperature, snowfall, and snow depth thresholds (pictured right). Daily scores are accumulated through the winter season, allowing a running total of winter severity in the midst of a season, as well as a final, cumulative value characterizing the full season. Accumulations of the temperature and snow components of the index are computed separately and then added together for the total index. This allows comparison of the relative contribution of each to the total score.
The AWSSI has been processed for 365 locations across the continental U.S. to provide a variety of locations in different climate regimes for analysis. The AWSSI is calculated for each season from 1950‐1951 to the current winter season. The seasonal data is then subject to quality control, and seasons missing data that would contribute 5% or more of the seasons AWSSI are removed . Averages and standard deviations are calculated for running accumulations of daily temperature and snow scores as well as the total AWSSI.
National - Lower 48 - temps.:


