
JACKSONVILLE, Fla. — To become a part of the First Alert Neighborhood weather station network - scan below &/or click * here *:

The 2025 Atlantic hurricane season gets underway Sunday, June 1st. As always - since 2005 - I’ll update “Talking the Tropics With Mike” every day through the season (Nov. 30th). The forecast is for an “above average” season but, of course, how a season is remembered depends on any landfalls & the intensity & impacts of those landfalls. An “average” season is 14 named storms, 7 hurricanes & 3 major (Cat. 3+) hurricanes. The first name this season is “Andrea” (names repeat every 6 years & “Dorian” was retired from the 2019 season & replaced with “Dexter”).


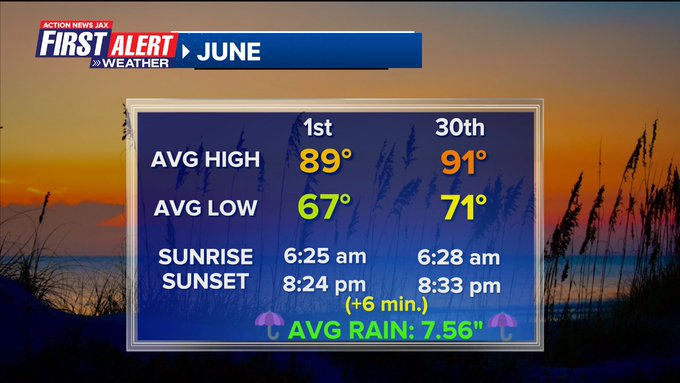
And so we turn the calendars to June. Summer is here no doubt!
It’s time to celebrate the St. Johns River! Get Your Feet Wet with St. Johns Riverkeeper! St. Johns Riverkeeper (SJRK) is celebrating its 25th Anniversary throughout 2025! Celebrate by joining SJRK and fellow river enthusiasts for events throughout the St. Johns River Watershed. Click * here * to find a list of St. Johns River activities & clean-ups.

“Tideschart” - credit & link * here * - has come up with a list of the cities with the most unpredictable weather. No surprise - the Midwest is the most difficult to forecast though Florida cities did rate high (unpredictable) for rainfall variability.
Oklahoma City has the most unpredictable weather in the US and scores 81.06 out of 100 in this study. The city recorded high variations in rainfall with an average of 0.51 inches a day (the fourth highest overall) and daily wind speed deviations of 4.06 mph (the second highest nationally).
Omaha, Nebraska ranks second most unpredictable with 79.77 points. In Omaha, temperature swings were more extreme than any other major city in the study. Average temperature variations in Omaha hit 20.82°F, while maximum temperature changes reached 21.50°F. Omaha was discovered to also be the city most likely to see unexpected changes, with an average wind speed deviation of 4.35 mph on an average day.Minneapolis, Minnesota secured third place with 68.96 points on the unpredictability scale, where people face some of the most drastic temperature changes nationwide. Most notably, the city saw standard deviations of 22.40°F in average temperatures and 23.05°F in maximum temperatures.
Kansas City scored 68.61 points and Louisville reached 68.17, rounding out the five cities with the US’s most unpredictable weather patterns.
Oklahoma saw a second city land in the top ten most unstable weather locations, as Tulsa secured sixth place with a score of 65.76. This was then followed by Indianapolis, Indiana in seventh place with a score of 64.63. Chicago, Illinois ranked closely behind in eighth with a score of 63.74.
Rounding out the top ten are two Texas cities, with Arlington receiving 63.43 points, and Fort Worth scoring 62.52.
The West Coast tells an entirely different weather story, with the study showing significantly more stable and predictable conditions across major cities. Long Beach, California recorded the lowest score at just 19.85 out of 100, making it the most predictable major US city for weather, where residents rarely need to worry about sudden storms or temperature plunges.
Los Angeles followed at 21.49 points, with San Diego scoring 21.75, Seattle reaching 24.72, and Portland recording 27.68. California claimed six cities among the ten most stable weather locations, highlighting the state’s consistently reliable climate patterns that make weather forecasting much more accurate.
The research examined weather patterns across the nation’s 50 highest-populated cities through five different weather measurements. Using figures from the National Centers for Environmental Information (NCEI), the experts anaylzed how much the rain, temperature, and wind speed varied from day to day.
Methodology: A total of five factors, which were sourced from the National Centers for Environmental Information (NCEI) were used to compile the index. The factors and their percentage weightings are:
- Standard deviation of daily precipitation (inches) - 30% weighting
- Standard deviation of daily average temperature (F) - 20% weighting
- Standard deviation of daily maximum temperature (F) - 10% weighting
- Standard deviation of daily minimum temperature (F) - 10% weighting
- Standard deviation of daily average wind speed (mph) - 30% weighting
The raw data for each factor was cleaned, checked, and standardized on the same scale from 0 to 10, where 0 and 10 represent the worst and best values present in the data. A weighting was then assigned to each factor reflecting its importance within the analysis.
Once the weightings were assigned, the total score for the factors was calculated, producing an overall index score out of 100 for each entry, upon which the final ranking is based.
The standard deviation of a metric is the typical distance from the average of that metric. Most of the data (around 68%) is closer to the average than one standard deviation. The higher the standard deviation, the more the data is spread out and therefore more unpredictable.


