
How tariffs are impacting U.S. state economies in 2025
Tariffs may be national policy, but their impact plays out at the state level in dollars, jobs, and rising costs. From the farm fields of California to the auto plants of Michigan, nearly every region is seeing higher import costs and added pressure on key industries.
New data shows how deeply states depend on trade with Canada, China, and Mexico, and just how much recent tariffs are affecting local economies. While the full picture is still unfolding, many economists warn that policy uncertainty is becoming a drag on long-term business planning.
New tariffs on goods from Canada, China, and Mexico are putting pressure on U.S. industries, especially agriculture, manufacturing, construction, and retail. These sectors rely heavily on imported materials or foreign buyers. From steel and lumber to dairy and grains, many essential goods now carry a higher price tag.
To analyze how much impact tariffs will have on specific state economies, and the industries that cause this impact, Gateway Commercial Finance, an invoice factoring company, looked at data from the International Trade Administration, Trade Partnership Worldwide, and the U.S. Bureau of Economic Analysis. The rankings below are based on how much of each state's GDP comes from affected industries, how export-heavy they are, how much they rely on the three trade partners, and how much more they're projected to spend on imports. States with strong trade ties or low self-sufficiency tend to feel the squeeze more.
Tariffs and their uneven impact across states
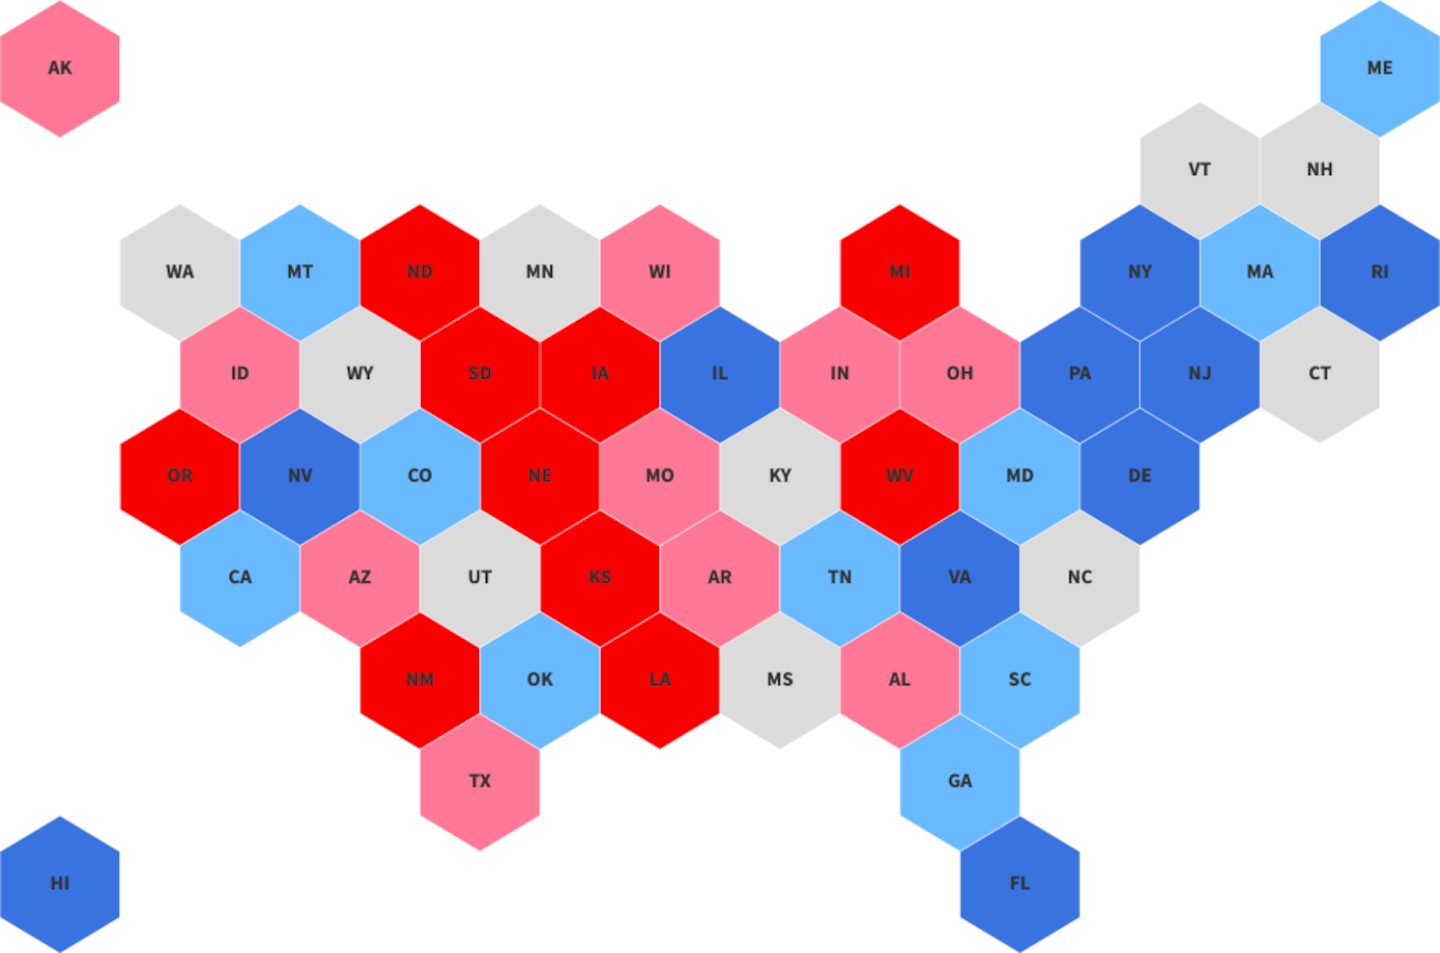
Gateway Commercial Finance
Louisiana, North Dakota, and Iowa rank as the top three most affected states, thanks to their reliance on agriculture and manufacturing. Others in the top 10, including South Dakota, Oregon, Nebraska, West Virginia, New Mexico, Kansas, and Michigan, show similar vulnerabilities.
Tariff policy is a moving target. As negotiations shift, so do the rules and ripple effects. Federal Reserve officials have called for patience in evaluating the long-term economic impact of tariffs, acknowledging the challenge of forecasting amid policy swings.
States most reliant on tariff-impacted industries
Most states lean heavily on industries hit hardest by tariffs. In 48 out of 50 states, more than half of the GDP comes from sectors like agriculture, construction, manufacturing, or retail.
Indiana tops the list, with about 154% of its GDP tied to overlapping sectors, largely due to its manufacturing base. Louisiana and Iowa follow, relying on a mix of agriculture and industrial trade.
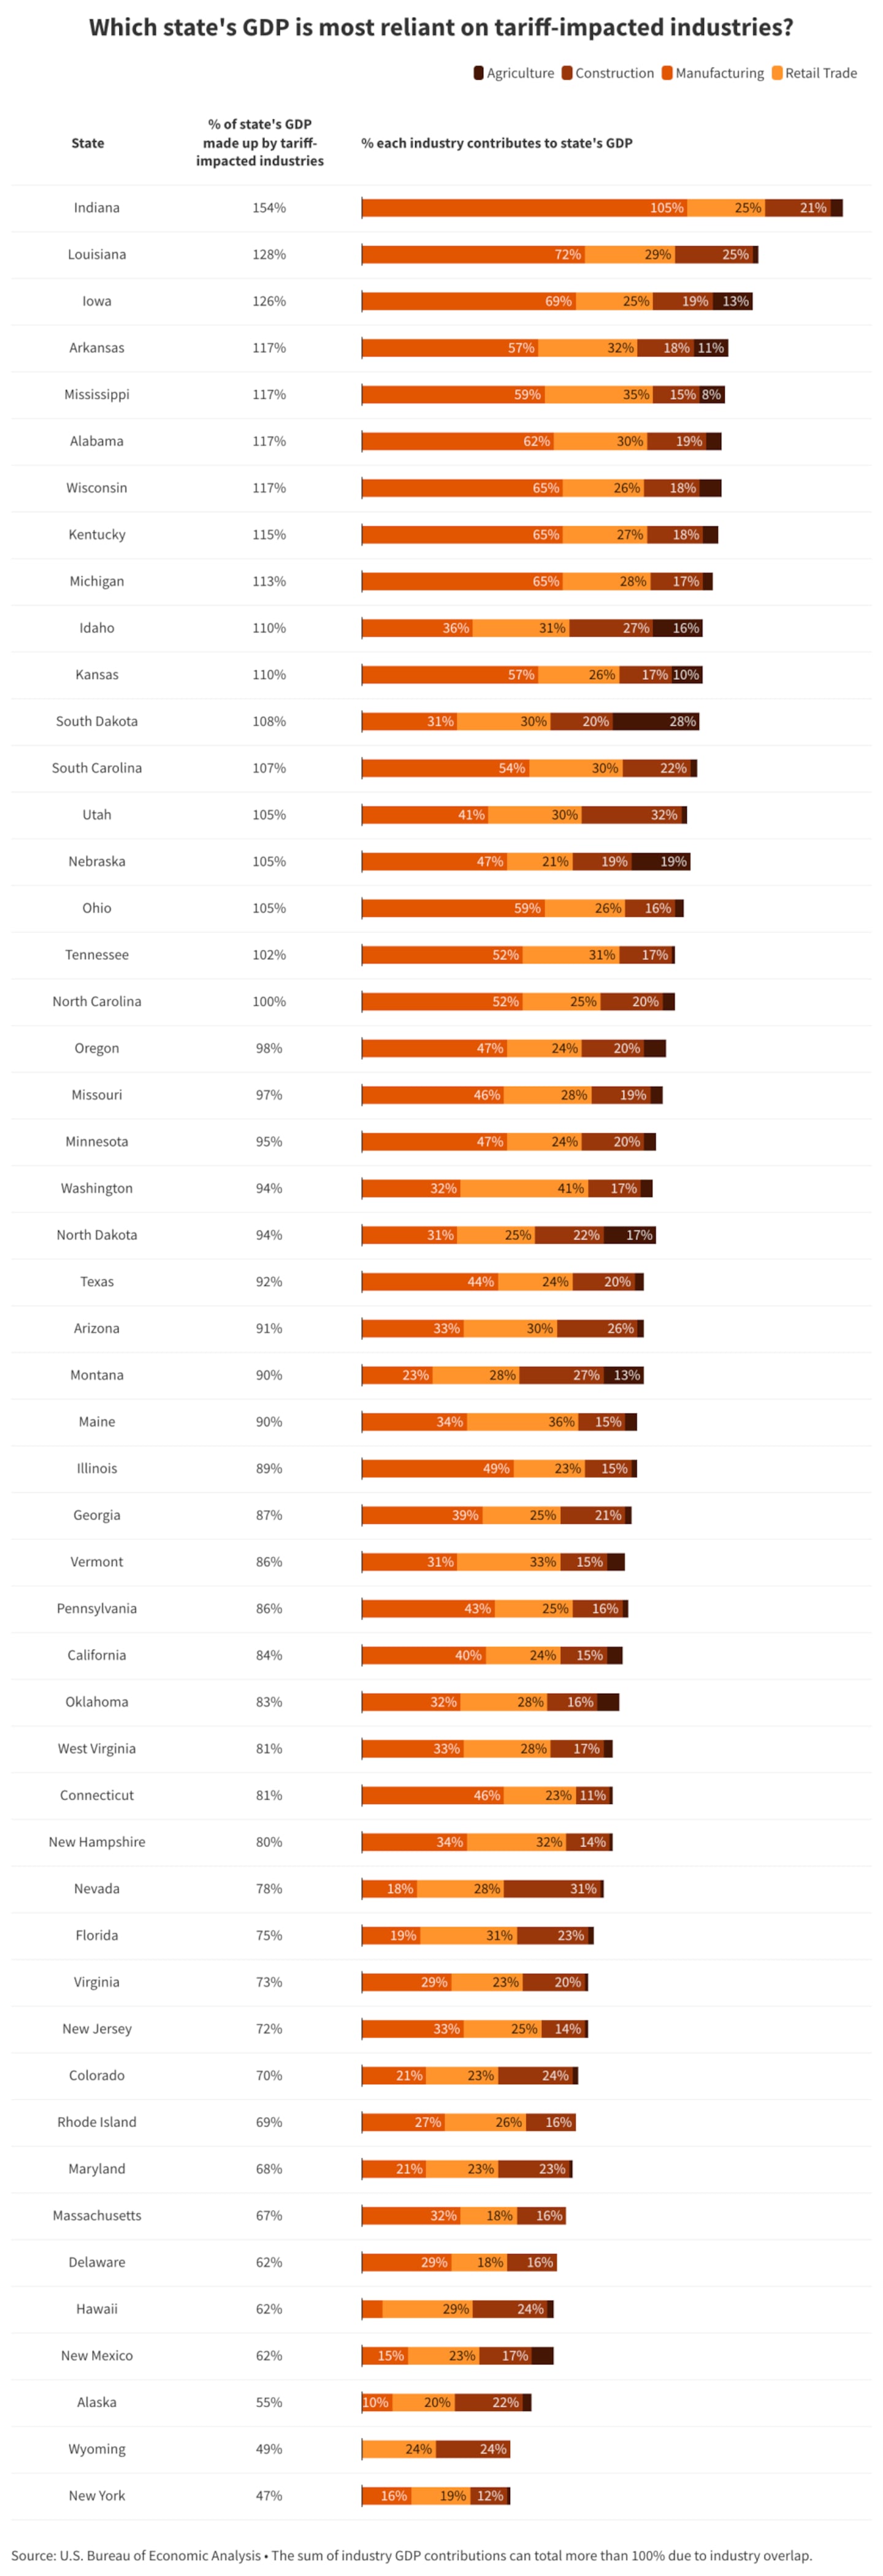
Gateway Commercial Finance
Other high-dependency states include Arkansas, Mississippi, Alabama, and Wisconsin, with similar economic makeups. Kentucky, Michigan, and Idaho also show strong ties to tariff-exposed industries.
Even small policy shifts can ripple across these economies, making them particularly sensitive to rising costs.
State-by-state dependence on key trade partners
Every U.S. state imports from Canada, China, or Mexico, but reliance varies. Canada is the top trade partner for 26 states, Mexico for 13, and China for 11. These ties reflect regional trade routes and dominant local industries.
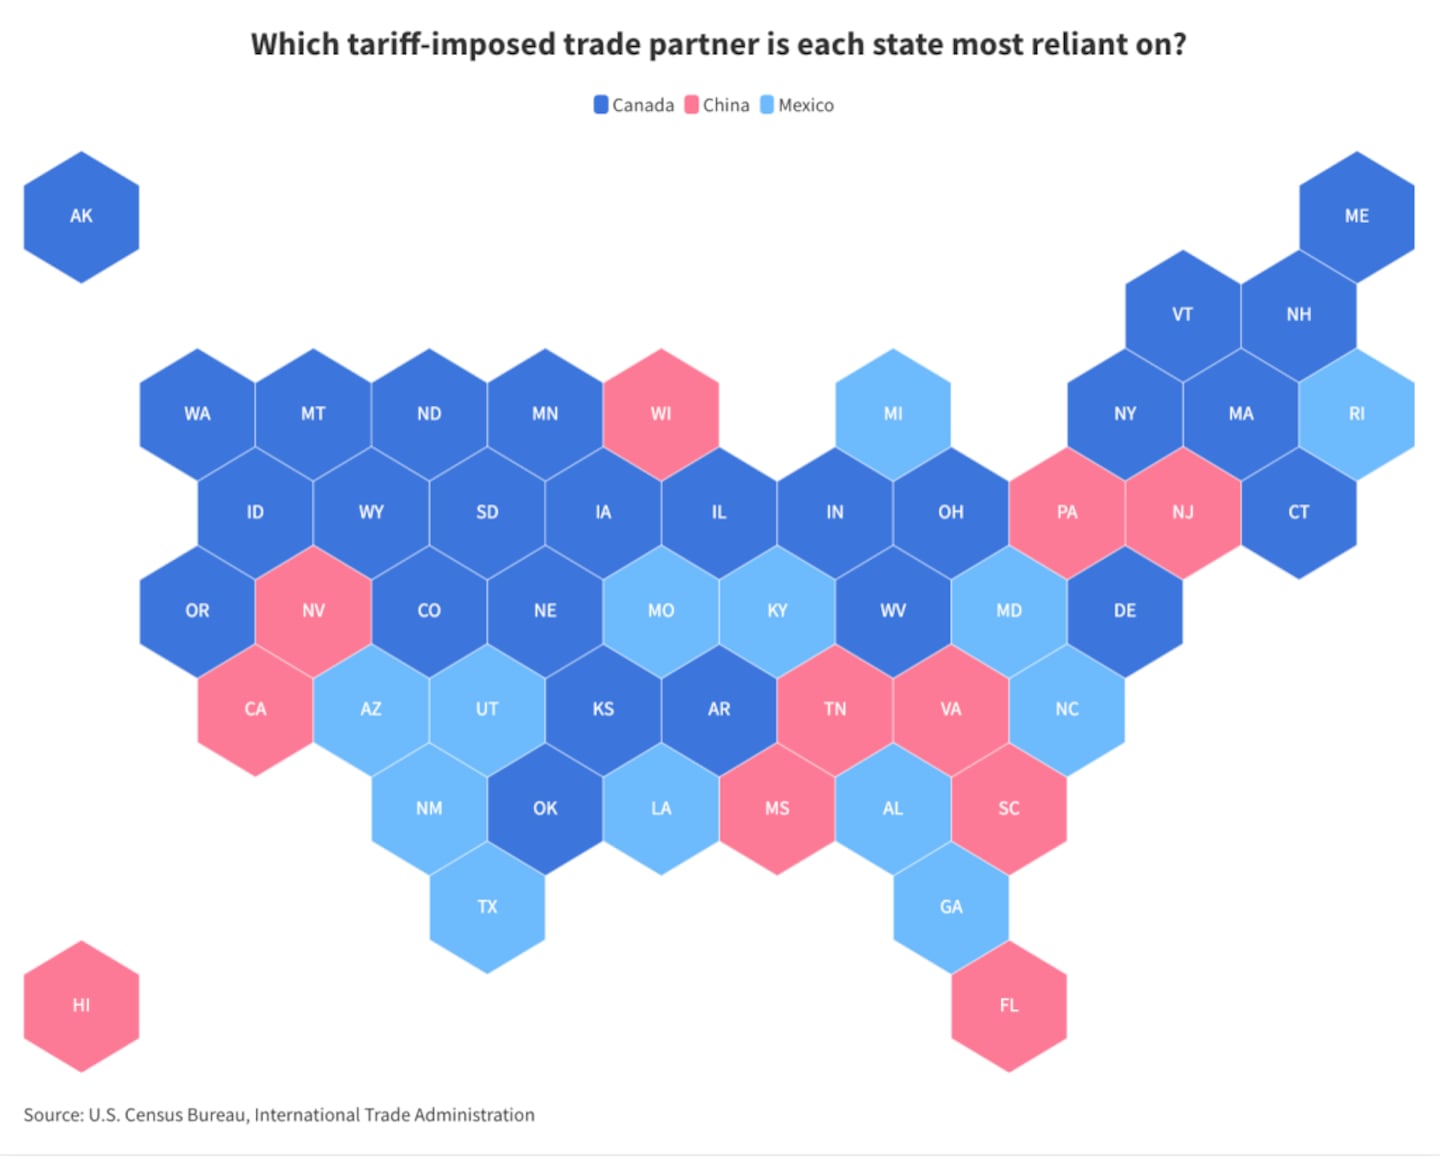
Gateway Commercial Finance
Gateway Commercial Finance
States with the lowest export-to-import ratio with tariff-imposed trade partners:
- Hawaii
- Montana
- Oklahoma
- Rhode Island
- Illinois
- Maine
- Utah
- Vermont
- Michigan
- California
States with the highest export-to-import ratio with tariff-imposed trade partners:
- Louisiana
- Oregon
- Alaska
- New Mexico
- South Dakota
- North Dakota
- Nebraska
- Kansas
- Iowa
- West Virginia
Looking at export-to-import ratios between these three countries and each state adds more context. For instance, Hawaii, Montana, and California import more than they export to these trade partners. Their low export-to-import ratios make them less reliant on foreign buyers but more exposed to rising import costs as tariffs increase.
Other states, including Louisiana, Oregon, and many in the Midwest, export more than they import. Shipping out more than they bring in from the affected countries makes them more vulnerable to retaliatory tariffs.
This import-export balance helps explain which states show up most in tariff impact rankings. The deeper the trade ties, whether as buyers or sellers, the harder it is to adapt as tariffs affect global supply chains.
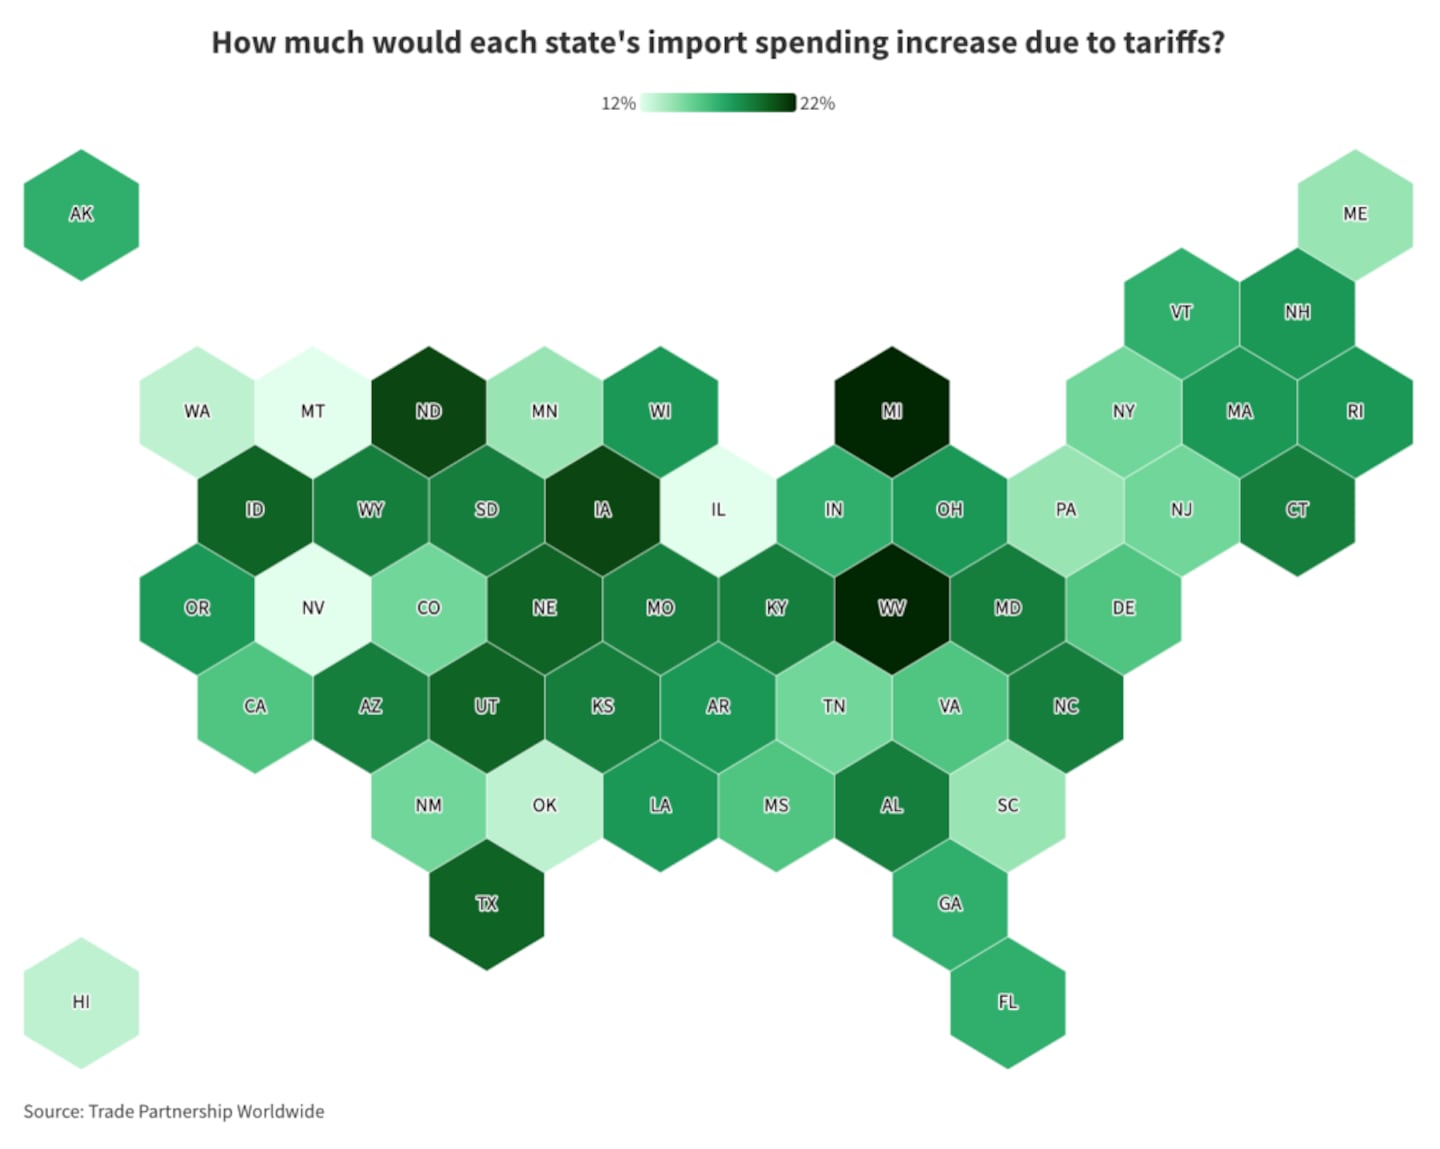
Tariffs are driving up import costs—everywhere
No state is spared when it comes to the rising cost of imports caused by tariffs. According to the latest data, every U.S. state is projected to spend at least 12% more on imported goods in 2025 than it did in 2024. The increase is tied directly to new tariffs imposed on imports from Canada, China, and Mexico. This surge in costs is already feeding concerns about inflation in both consumer and industrial markets. Investopedia recently noted that while inflation appeared steady in early 2025, the threat of rising tariffs clouds the outlook moving forward.
The map below shows how import cost increases vary across the country. Most states cluster near the lower end of the range, but several stand out. Michigan and West Virginia face the sharpest increases, with estimated import spending climbing by 22%. These states have economies that depend on products like auto parts, machinery, and other tariff-impacted goods. When the price of these imports goes up, their overall spending jumps more dramatically.
Gateway Commercial Finance
The national impact is massive. Tariffs are expected to add around $233 billion in extra import spending for the U.S. as a whole. Some states are absorbing a bigger share of that total. Texas would spend roughly $47 billion more due to tariffs. California would see a $33 billion increase. Michigan, despite its smaller size, is projected to spend an additional $28 billion.
These rising costs will reach businesses, consumers, and state budgets alike. While the percentages vary, the trend is universal: Tariffs are making imports more expensive everywhere.
The bottom line on tariffs and state economies
Tariffs aren't just a foreign policy tool. They have real, measurable effects on state economies across the U.S. As import costs rise and trade relationships shift, states that rely heavily on industries like agriculture, manufacturing, and retail are feeling the most pressure. The data shows that no state is untouched, and some are absorbing billions more in costs. Moving forward, staying aware of how these policies affect local economies will be key for businesses, lawmakers, and consumers alike.
Methodology
For this study, Gateway Commercial Finance ranked states based on presumed tariff impact. To do so, we looked at four metrics and assigned specific weights when determining our state-level ranking:
- Percentage of imports that come from Canada, China, or Mexico via the International Trade Administration and the U.S. Census Bureau (30%)
- Estimated increase in import spending resulting from tariffs via Trade Partnership Worldwide (25%)
- Export value to import value ratio from Canada, China, or Mexico via the International Trade Administration and the U.S. Census Bureau (25%)
- The percentage of each state's GDP that is made up of impacted industries (agriculture, construction, manufacturing, and retail trade) via the U.S. Bureau of Economic Analysis (20%)
The results in this study are purely based on the published data from the aforementioned sources; no additional data analysis was conducted to alter any figures.
This story was produced by Gateway Commercial Finance and reviewed and distributed by Stacker.


